Hold on … plants playing music, come on, really? Yes! And by listening closely you may find a better understanding of plants and of yourself!
By measuring microcurrent fluctuations occurring across the surface of a plant’s leaf, this Biodata Sonification device generates MIDI notes when a change in conductivity is detected, allowing a user to listen into the invisible biological processes occurring within plants.
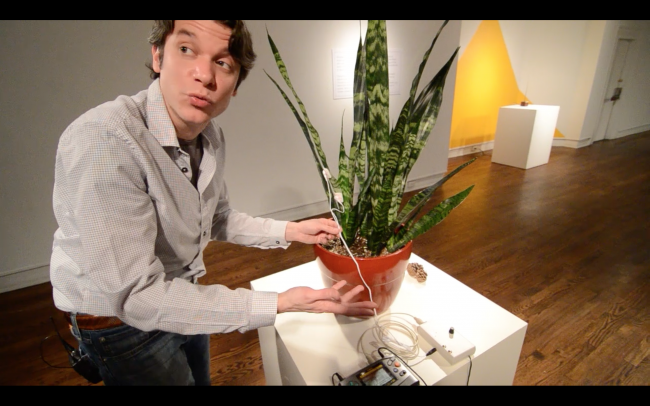
Here you can see two electrodes are connected to the leaves of a Snake Plant using ‘Tens’ style sticky pads, which are reusable, washable, and ‘plant-safe’.
How it works….
Tiny changes in electrical conductivity are measured between the electrodes and fed into a programmable microcontroller. Changes are detected using averages and standard deviation calculations which turn on LEDs and produce MIDI Notes and Control Changes. The circuit used to detect biological galvanic conductance is based on a 555 timer IC set as an astable multivibrator, similar to a simple lie-detector.
The exploration and practice of Biodata Sonification can allow a student, musician, scientist, or florist to listen in on the secret life of plants, and understand how your tools work!
Development and Future of Biodata Sonification
This device began as an interactive human touch music project with my friends Jon Shapiro and Gus Depenbrock, developing into a plant-focused system with Data Garden and growing as I designed the MIDI Sprout, the project evolved further with my work at Haverford College using a wifi daughter board for the Adafruit Circuit Playground, and now continues as a part of my educational Biodata Sonification project using the Adafruit Feather ecosystem providing serial MIDI, Bluetooth MIDI, WiFi MIDI, or even direct translation of biodata into musical sounds!
One key aspect of this biodata system is the electrical isolation of the plant sensor, similar to a medical device, we need to ensure that the plant is not impacted by the sensor in order to detect how it reacts to stimulus ‘in nature’. One way this is done is by using MIDI which is opto-isolated, an additional level of separation can be provided by bluetooth and wifi wireless connections. USB connections are usually not isolated, and special circuitry is required in order to have charging, USB/MIDI, or other ‘wired’ connectivity. This also means that using battery power is much preferred over having the device plugged into a power supply.
Bluetooth MIDI is very well implemented on most Android and iPhones, as well as modern computers, making it a great way to connect one (or perhaps two) biodata systems to a computer/phone.
While working with Biodata Sonification I have found that connecting multiple plants to produce music can be very challenging, and the desire to collaborate with other plants over long distances is strong. In order for plants from multiple locations to be monitored/listened to simultaneously, we can use RTP-MIDI. This service allows MIDI to be sent over a local (wifi/ethernet) or external (internet) networks. By using services like McLaren Labs MIDI Cloud who provide MIDI Chat Rooms, we can connect multiple MIDI streams and listen to plants from around the world!
After a series of iterations, I always have errors and mistakes on my first run of circuit boards, I have a successful Bill of Materials listing (BOM) and designs for a Biodata Feather Wing circuit board. This daughter board should work with many of Adafruit’s Feather main boards, while this has been specifically built for the ESP32-S3 Feather. I’m hopeful it will additionally work with some of the Bluetooth boards, will just need to ensure the pins in usage for the IO and serial port for MIDI are not conflicting.
For those who want to build their own or review the details of of the system works, all of the files and so much more are available on my Electricity for Progress GitHub repository
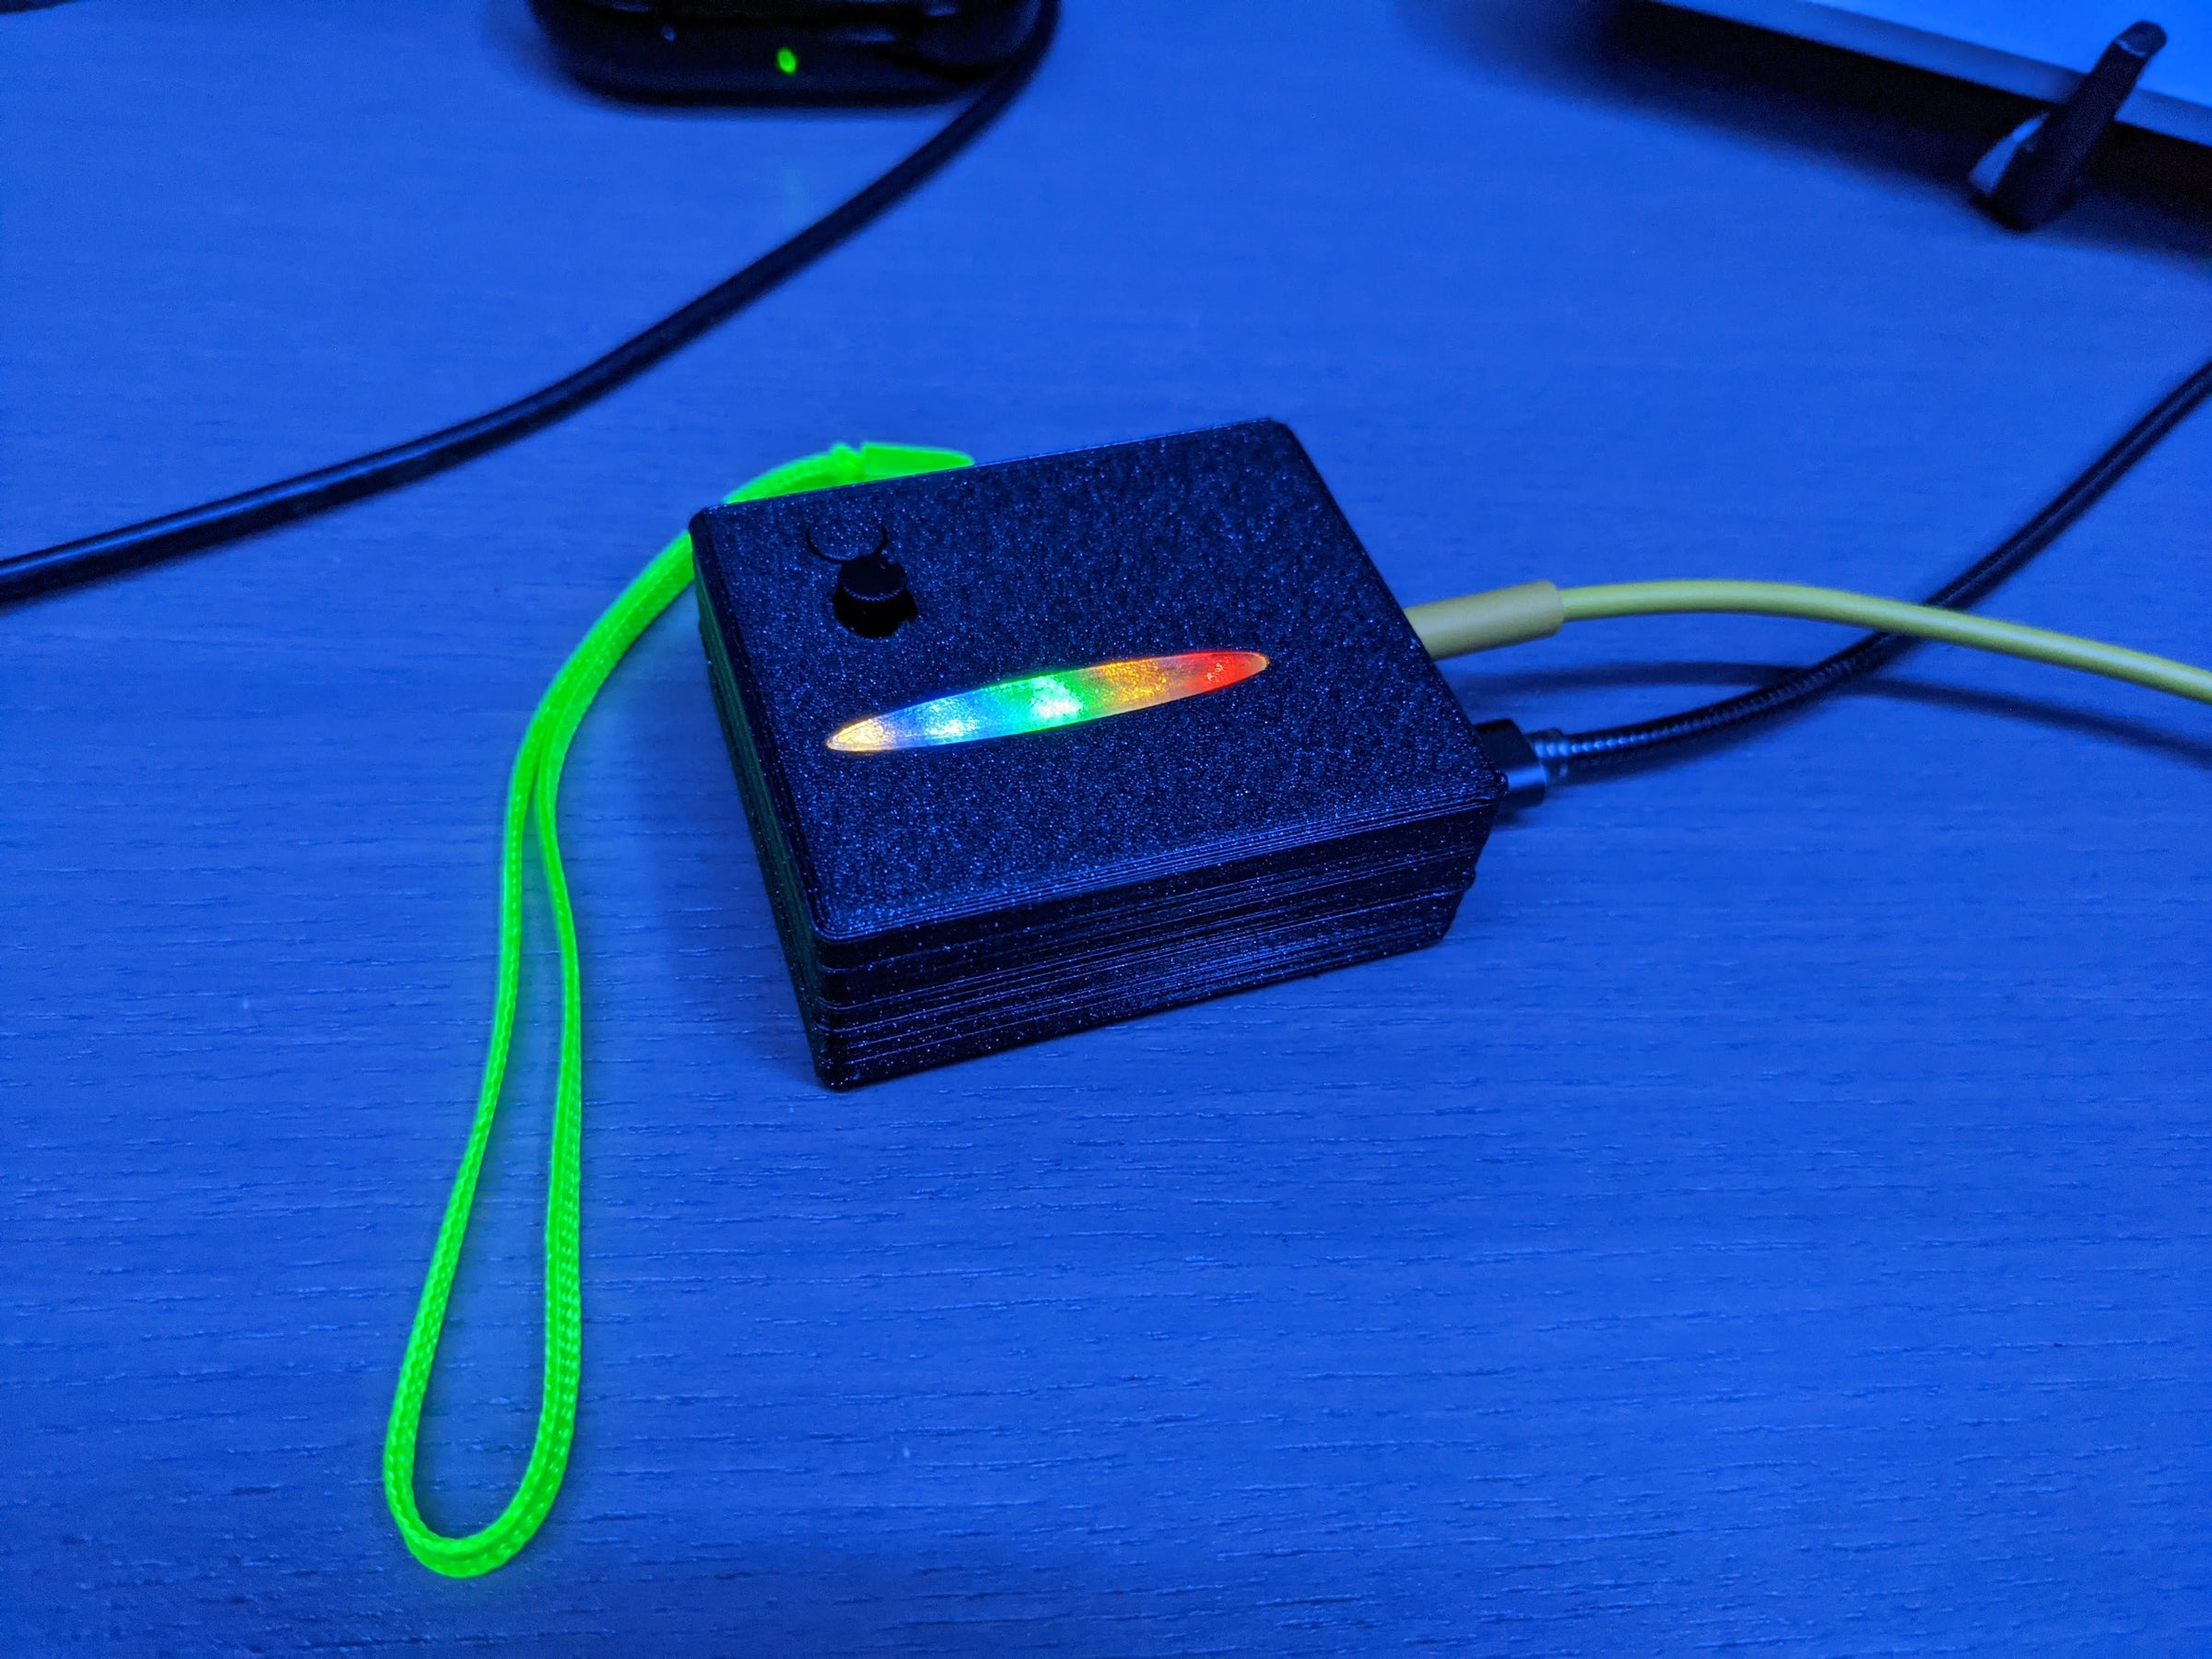
I also have designed a neat (simple) 3D printed enclosure which allows a LiPo battery to be stacked along with the Feather and Biodata boards. Check it out on Tinkercad.
What is MIDI ?
MIDI is a language for computers to talk to synthesizers, drum machines, and other electronic devices in order to play music. Classic synthesizers in the 80’s began to adopt the MIDI 5-pin DIN standard connector allowing interconnectivity for synchronization of timing/beats and allowing elaborate and repeatable programming of multiple devices. This revolutionized recording studios and live stage production, bringing a new level of digital control of instrumentation. In the modern day using big DIN cables does feel clunky and cumbersome, now BLE bluetooth and WIFI RTP-MIDI can allow wireless connections between music making devices, phones, computers, and even the internet.
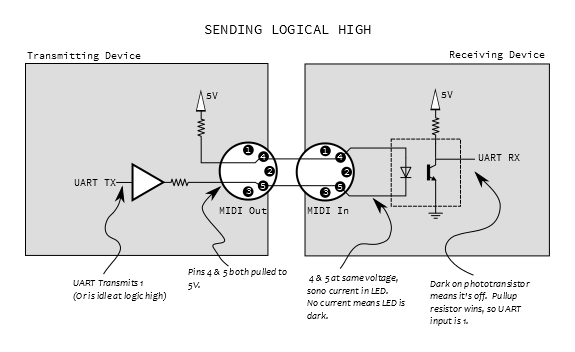
Standard MIDI specifications allow connected devices to be ‘electrically isolated’ using optical transistors on the Input of any MIDI synthesizer. By ensuring electrical isolation, MIDI prevents old synths which may be in poor repair from destroying any other equipment it is connected to. This also limits any noise which would be present in the audio output of an interconnected synth or drum machine.
Review Sparkfun’s MIDI information page for excellent details about MIDI circuits, pinouts, and how MIDI is used!
For these reasons I have chosen MIDI as the musical data transport for this system. The plant and electrodes are provided with some level of electrical isolation, and MIDI can be easily used with keyboards, computers, and many other musical devices.
What does it all mean?
Ask a botanist, biologist, philosopher, or florist and try it for yourself! While there are always flourishes and strange/exciting events heard when interacting with a plant, as an engineer I personally am interested in the longer sets of raw data. I want to better understand how the plants change over many days, cycles, seasons, and how using this type of recorded data may be able to help measure and track plants in nature, in the office, on the farm, and in the lab under study.
The data which is produced by the Biodata Sonification system is not inherently ‘musical’ in itself. The biodata readings do not occur ‘on beat’, rather a note is generated when a change is detected within the plant with pitch corresponding amount of change. This is sometimes a criticism of the device, as users hope that plant music will sound magical ‘out of the box plant’. It can be challenging to use the relatively thick data stream of MIDI notes, while the threshold knob on the Biodata system can help to reduce the number of notes. As many users can attest, the rich MIDI data can be very useful for creating lush multi-instrumental soundscapes. Filters added to the MIDI data can allow ‘scaling’ and limiting of notes. Scaling of the notes can quickly take the raw biodata and make it sound musical or like a lullabye. Personally, I prefer working with the Raw data in hopes of better understanding the environmental conditions which influence changes and patterns.
When it comes to Biodata Sonification experimentation is key, and you may never hear the ‘same’ sounds again! The notes coming out of my system sound and ‘feel’ fairly random (a common criticism), but over long periods of time there are very real patterns which emerge and these are the daily cycles of activity happening within each plant. The algorithm detects changes in electrical conductivity, and the ‘amount of change’ is represented by a number/musical note.
Below is an image of MIDI data over a 16 hour session with a Monstera on top and a trusty Snake Plant at the bottom. You can see the ‘waves’ and changes in the overall pitch, density, and distribution of the notes. This type of process is really hard to ‘hear’ during a brief performance, and if the performance is at the wrong time of day (or in the wrong environment) there might not be any notes at all! Plants play a long-game and the patient are rewarded.

Below you will find an image showing raw MIDI Biodata which was recorded over multiple days from the Snake Plant sitting on my office desk. Laid out in a row the colored Clips show examples of MIDI data from different times of day. You can easily see by the distribution of notes in each Clip that the overall pitch or root note varies throughout the day, while the structure of the biodata signal is similar in each segment.

You can see in the second ‘brown’ clip that the MIDI notes appear to be slowly moving downward in pitch. You can also see the final ‘magenta’ clip from the ‘early morning’ shows notes very tightly distributed compared against the ‘orange’ clip from earlier in the evening.
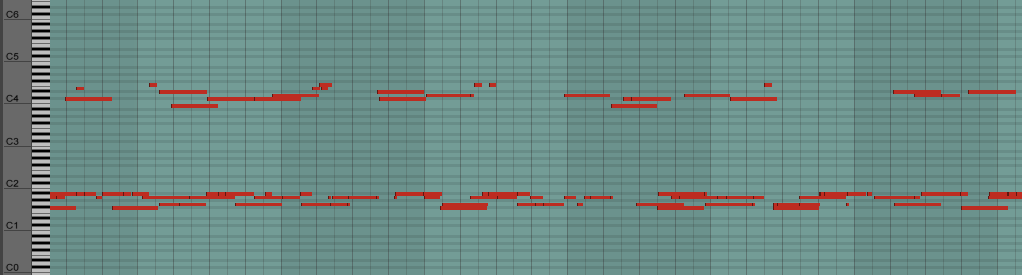
In the MIDI piano roll images below, you can see a zoomed in segment of each recording.
- We can see two ‘parallel’ rows of notes with flourish and outliers near the high and low band of MIDI.
- In the Evening segment the low notes are well below C2
- We can see that by the Morning the lowest notes have crept up around C2
- In the third image the data from the Afternoon shows the lowest notes well above C2
This upward flow is a very common type of progression seen in the Biodata throughout a normal day. Had I recorded data for longer, the signals would have slowly (and sometimes abruptly) reduced back down to lower octaves. The ebbs and flows of the plant’s biological cycle.
I have included audio recordings of the ‘sonification’ of this MIDI data and links to the MIDI tracks themselves which are considerably longer. For this rendering I am using the ‘Chimes and Bow’ Instrument in Live 9 which splits the low notes to a low bowed bass string, spooky mid tones, and high notes in crispy chimes.
MIDI File – <…>